


A discounted cash flow (DCF) model estimates what a stock is worth today by projecting the money its business can generate in the future and discounting those cash flows at an appropriate required return. It converts business forecasts into an estimate of intrinsic value per share, which investors can compare with a market price. The critical point is that higher interest rates can reduce a DCF valuation even when projected cash flows do not change.
This matters in the current US rate environment. The Federal Reserve raised its policy target by 25 basis points in September 2026 and held it at 3.75%–4.00% in October. The US Treasury reported a 10-year yield of 4.86% on November 6, 2026, versus 4.11% on November 6, 2025, an increase of 75 basis points. The yield had also retreated from 5.31% on October 5, 2026, so the rise was not continuous. This guide explains the calculation, then shows exactly how changing rates can alter the result.
What Is Discounted Cash Flow Valuation?
DCF is the application of a basic finance principle: one dollar received several years from now is generally worth less than one dollar received today. The difference reflects the return investors could earn elsewhere, inflation, and the uncertainty of receiving future cash.
The CFA Institute’s free cash flow valuation framework distinguishes free cash flow to the firm (FCFF), available to debt and equity investors, from free cash flow to equity (FCFE), available to common shareholders. This example uses FCFF, discounts it at the weighted average cost of capital (WACC), and then converts enterprise value into equity value.
DCF formula: Enterprise value = sum of [FCFF in year t ÷ (1 + WACC)^t] + terminal value ÷ (1 + WACC)^n.
Here, t is the forecast year, n is the final forecast year, FCFF is annual free cash flow to the firm in US dollars, and WACC is the annual discount rate in decimal form. This simplified model assumes year-end cash flows and a constant WACC.
Step 1: Forecast Free Cash Flow, Not Just Earnings
An equity valuation should ultimately connect to cash generation. A common operating approach is FCFF = EBIT × (1 − tax rate) + depreciation and amortization − capital expenditures − increase in operating net working capital. An increase in net working capital uses cash; a decrease releases it. EBIT means operating profit before interest and taxes.
Start with historical revenue, margins, capital spending, and working-capital trends from the company’s 10-K and 10-Q filings in the SEC EDGAR database. Forecast business drivers such as sales growth and reinvestment rather than extending last year’s cash flow mechanically. Our guide to reading quarterly earnings and spotting financial red flags explains how to investigate cash conversion and unusual adjustments.
Hypothetical model: Assume a fictional US company will produce the following FCFF over five years, in USD millions. The amounts are educational assumptions, not reported results for any public company.
| Forecast year | FCFF ($ million) | Discount factor at 9% | Present value ($ million) |
|---|---|---|---|
| 1 | 110 | 0.9174 | 100.92 |
| 2 | 120 | 0.8417 | 101.00 |
| 3 | 132 | 0.7722 | 101.93 |
| 4 | 143 | 0.7084 | 101.30 |
| 5 | 155 | 0.6499 | 100.74 |
| Total | 505.89 |
For year 1, the calculation is $110 million ÷ 1.09 = $100.92 million. By year 5, $155 million is worth approximately $100.74 million in today’s dollars. Discounting all five projected FCFF amounts produces $505.89 million.
Step 2: Choose a Discount Rate Using WACC
WACC measures the blended return required by shareholders and lenders. A common formula is WACC = (E ÷ V) × cost of equity + (D ÷ V) × after-tax cost of debt, where E and D are the market values of equity and interest-bearing debt, V = E + D, and after-tax cost of debt = pretax borrowing cost × (1 − marginal tax rate).
The cost of equity is often estimated using the capital asset pricing model: cost of equity = risk-free rate + beta × equity risk premium. Beta measures a stock’s sensitivity to broad equity-market movements; the equity risk premium is the additional return demanded for stock-market risk.
For illustration, using the observed 10-year Treasury yield of 4.86%, an assumed beta of 1.10 and an assumed equity risk premium of 5.0% gives a cost of equity of 4.86% + (1.10 × 5.0%) = 10.36%. These assumptions are not estimates for a named company. WACC also depends on its debt costs, tax position, and capital structure. For the worked DCF, assume a 9.0% WACC as a separate, simplified modeling input.
Do not substitute the federal funds rate or 10-year Treasury yield directly for WACC. Treasury yields influence the risk-free component, but credit spreads, business risks, leverage, and expected growth also matter.
Step 3: Calculate Terminal Value
Five years of forecasts cannot capture a company that may operate for decades. Terminal value estimates its value beyond year 5. Under the Gordon growth approach, terminal value at year 5 = FCFF in year 6 ÷ (WACC − perpetual growth rate), with year 6 FCFF = year 5 FCFF × (1 + perpetual growth rate).
Assume perpetual FCFF growth of 3.0%, below the modeled WACC of 9.0%. The model then produces:
- Year 6 FCFF = $155 million × 1.03 = $159.65 million.
- Terminal value at year 5 = $159.65 million ÷ (0.09 − 0.03) = $2,660.83 million.
- Present value of terminal value = $2,660.83 million ÷ 1.09^5 = $1,729.36 million.
Perpetual growth must be economically defensible and strictly below WACC. In this example, terminal value contributes approximately 77.4% of enterprise value. That concentration is a warning: a small change in long-run growth or discount-rate assumptions can produce a large change in the estimate.
Step 4: Convert Enterprise Value Into a Stock Price
Add the present value of the explicit forecast and the discounted terminal value. Then subtract net debt, which in this simplified example equals interest-bearing debt minus excess cash, and divide the resulting equity value by the assumed diluted share count.
| Valuation bridge | USD million, unless noted |
|---|---|
| PV of five-year FCFF | 505.89 |
| PV of terminal value | 1,729.36 |
| Enterprise value | 2,235.25 |
| Less net debt (assumed) | (300.00) |
| Equity value | 1,935.25 |
| Diluted shares outstanding (million, assumed) | 50.00 |
| Estimated value per share | $38.71 |
Suppose, purely hypothetically, the stock traded at $45. The DCF estimate of $38.71 would be about 14.0% below that price. It would not prove the stock is overvalued: different cash flow assumptions, risk estimates, or business developments could support other values. A real valuation must also account for nonoperating assets, preferred securities, minority interests, leases, and potentially dilutive securities when material.
Why Rising Interest Rates Matter So Much for DCF
A higher discount rate reduces the present value of each future dollar. It affects both the five forecast years and the much larger terminal-value calculation. This is the valuation mechanism behind the sensitivity of long-duration growth stocks, whose expected cash flows are concentrated further in the future.
Current policy and Treasury data make the point tangible. The Fed’s September 2026 rate increase raised the policy target to 3.75%–4.00%; its October meeting left the target unchanged. The 10-year Treasury yield was 4.11% on November 6, 2025 and 4.86% on November 6, 2026, a rise of 0.75 percentage points. However, the yield declined from 5.31% in early October 2026. The precise observation dates matter: interest rates have risen over a year, not in a straight line.
Higher Treasury yields can push up the cost of equity through the risk-free rate. They may also increase refinancing costs and the required return on corporate debt. That can reduce DCF values in two ways: a higher WACC, and potentially lower future FCFF if borrowing or operating costs rise. The effect is not mechanical: stronger earnings, reduced risk premiums, or improved cash flow expectations can offset some or all of the valuation pressure. For more on the market transmission mechanism, see how US inflation data moves the Nasdaq and technology stocks.
DCF Sensitivity: Change WACC, Keep Cash Flows Constant
To isolate the discount-rate effect, hold every forecast cash flow, the $300 million net debt assumption, and the 50 million share count constant. The table reports estimated equity value per share in USD for alternative WACC and terminal growth assumptions.
| WACC | 2% perpetual growth | 3% perpetual growth | 4% perpetual growth |
|---|---|---|---|
| 8% | $40.27 | $47.86 | $59.26 |
| 9% | $33.48 | $38.71 | $46.03 |
| 10% | $28.39 | $32.17 | $37.21 |
| 11% | $24.43 | $27.27 | $30.92 |
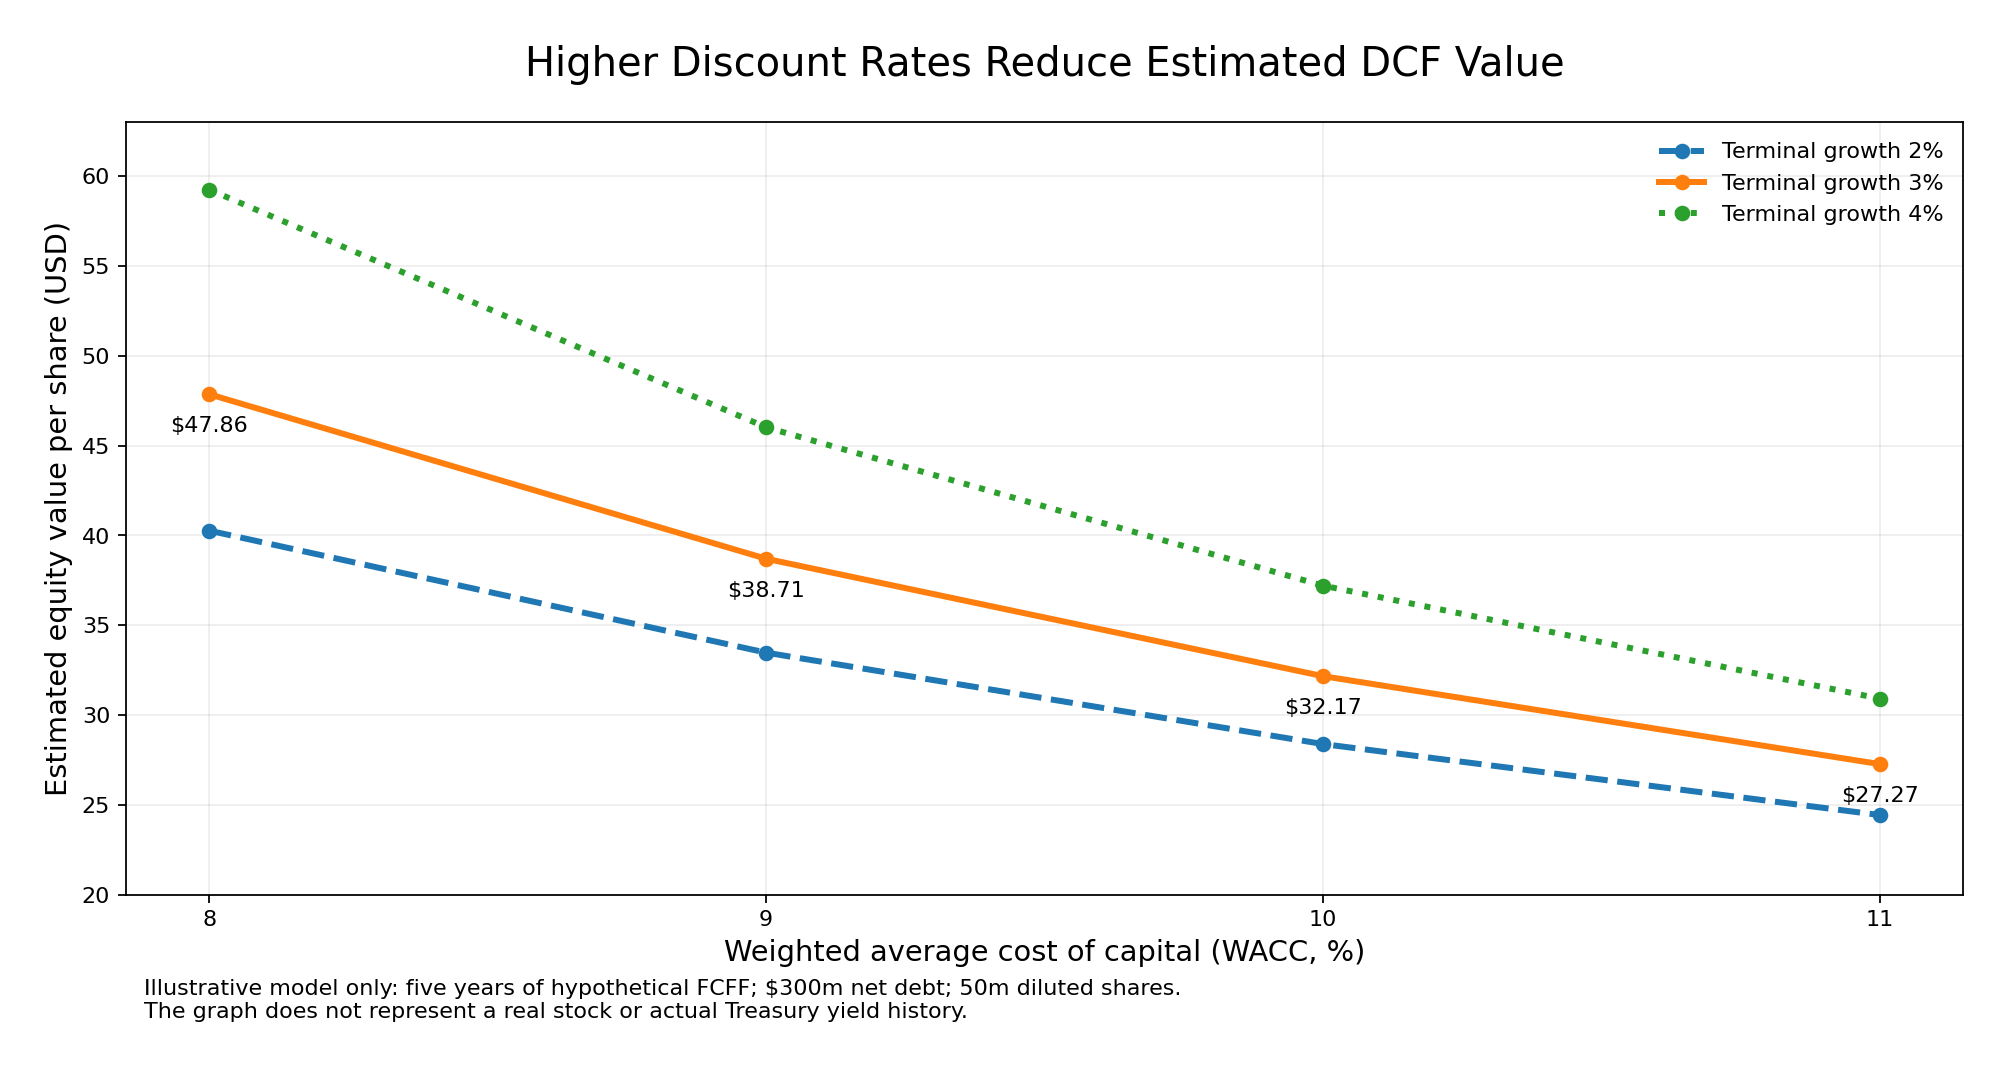
At a constant 3% terminal growth rate, changing WACC from 8% to 10% reduces estimated value per share from $47.86 to $32.17, a decline of approximately 32.8%. This is an illustrative scenario, not a claim that a particular Treasury yield change would translate into an identical WACC change. Notice also that at 9% WACC, raising the perpetual growth assumption from 2% to 4% moves the estimate from $33.48 to $46.03.
How to Build the DCF in Excel
Place the five forecast FCFF figures in one row or column and label them as USD millions. Enter WACC (9%), perpetual growth (3%), net debt ($300 million), and diluted shares (50 million) in separate assumption cells. Use these calculation steps:
- Discount each forecast year: =FCFF_t/(1+WACC)^t.
- Terminal value at year 5: =FCFF_5*(1+g)/(WACC-g).
- Discount the terminal value by /(1+WACC)^5.
- Sum discounted forecast FCFF and discounted terminal value to calculate enterprise value.
- Subtract net debt, then divide equity value by diluted shares outstanding.
Keep the percentages as numeric Excel percentage cells, not text. Check that forecast cash flows, debt, and share counts use compatible units. For related calculations, see our NPV versus IRR worked example and common financial modeling mistakes.
Common DCF Mistakes and Limitations
- Confusing cash flow definitions: FCFF should be discounted at WACC; FCFE is usually discounted at the cost of equity. Mixing them misprices the stock.
- Double-counting interest: FCFF is calculated before payments to debt investors, so do not subtract interest expense again inside an FCFF forecast.
- Overstating terminal growth: A perpetuity that grows nearly as fast as WACC can create unrealistically large values.
- Using outdated rates: Revisit the risk-free benchmark, debt costs, financing mix, and equity risk premium when market conditions change.
- Ignoring dilution and reinvestment: Stock-based compensation, new share issuance, capital expenditure, and working-capital needs affect the value attributable to each share.
- Treating a point estimate as certainty: Use a range of scenarios and compare DCF with market multiples, balance-sheet strength, and industry conditions.
DCF is less reliable when cash flows are highly unpredictable, capital structures change rapidly, or perpetual growth dominates the result. For banks and insurers, debt and operating cash flow require different analytical treatment; a standard FCFF enterprise-value model may not be appropriate.
Key Takeaways
DCF values a company by discounting future free cash flows, adding a terminal value, and converting enterprise value into equity value per share. In the hypothetical example, five years of FCFF, a 9% WACC, a 3% perpetual growth rate, $300 million of net debt, and 50 million diluted shares produce an estimated value of $38.71 per share.
The rise in US benchmark and Treasury rates makes the discount-rate assumption especially consequential. In this example, a two-percentage-point WACC increase cuts estimated equity value per share by about one-third without changing cash flow forecasts. That is a reason to test assumptions, not a prediction about any real stock. DCF works best as a decision framework and range of estimates, not a guaranteed price target.
Educational disclaimer: All company values, forecast amounts, capital structure figures, and scenario assumptions in the worked model are hypothetical. The cited Treasury yields and Federal Reserve decisions are historical observations as of the dates given. This material is general financial education, not personalized investment advice.