

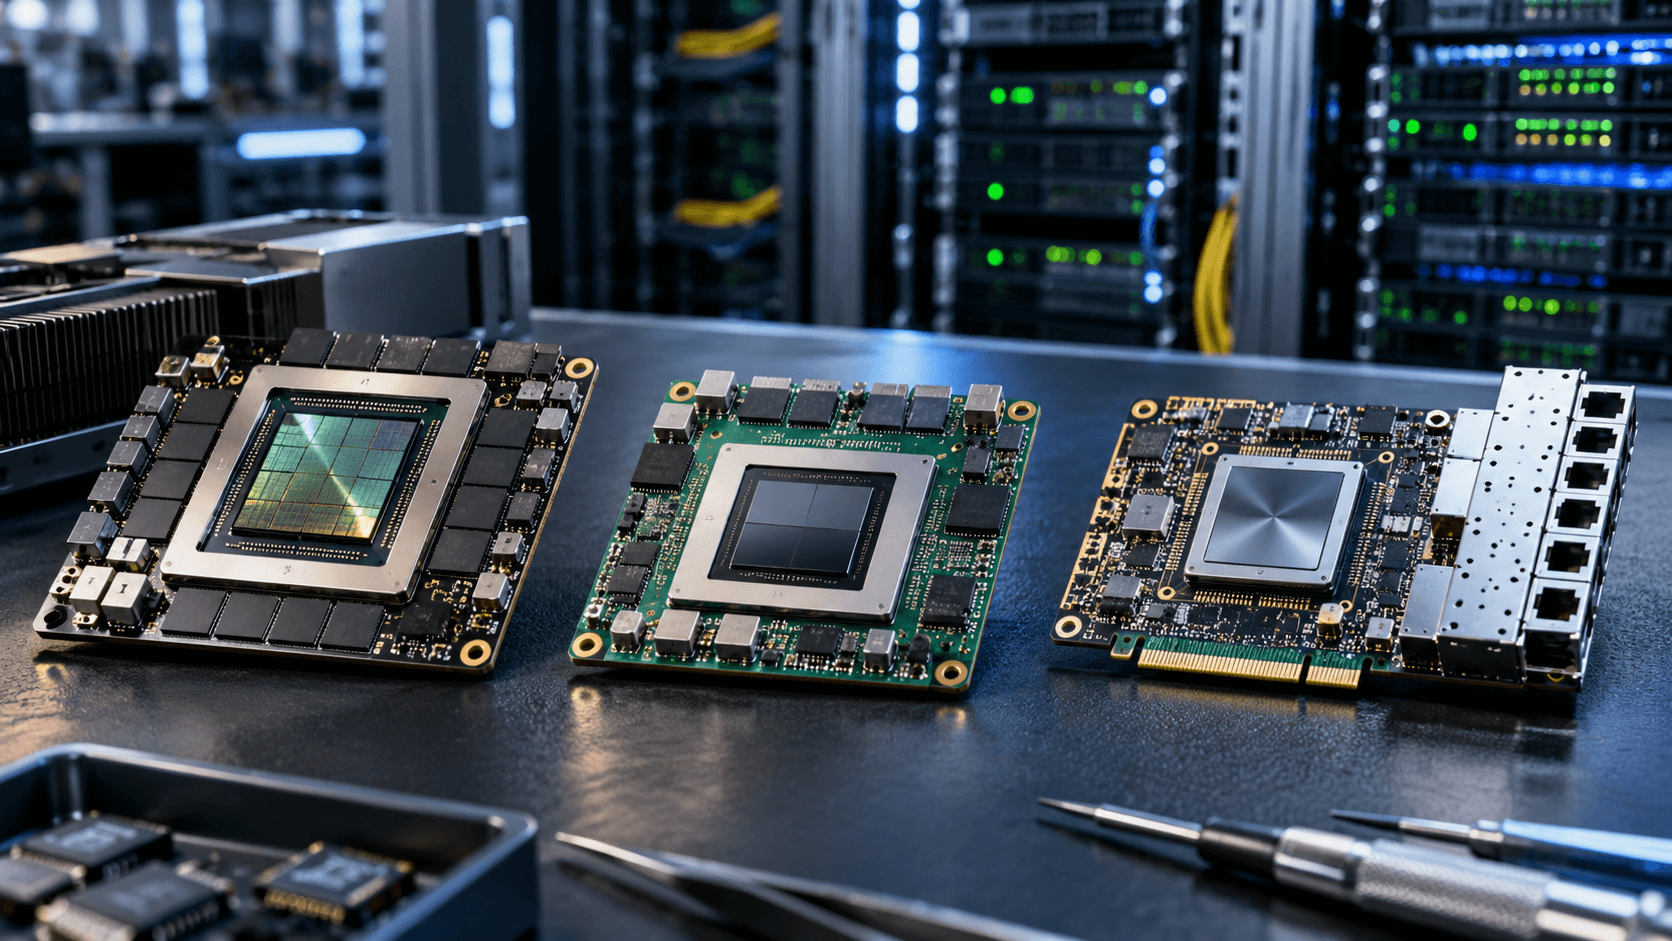
How do you analyze Nvidia, AMD, and Broadcom financial statements? Start with their business segments, compare revenue growth and GAAP margins, reconcile operating profit with cash flow, then inspect working capital, debt, and non-GAAP adjustments. The same financial ratio can mean something different for each company because their product mixes and funding requirements are different.
This comparison uses the latest quarterly reports available as of November 9, 2026: Nvidia’s second quarter of fiscal 2027 (ended July 26), AMD’s third quarter of calendar 2026 (ended September 26), and Broadcom’s third quarter of fiscal 2026 (ended August 2). These reporting periods are not identical. All dollar figures below are U.S. dollars, and financial statement amounts are GAAP unless labeled otherwise. Read the 10-K analysis guide for a broader framework.
1. Compare the income statements, not just the headlines
An income statement connects revenue to gross profit, operating income, and net income. Revenue growth shows demand; margins show how much of those sales the company retains after different types of costs. Start by checking the exact fiscal quarter and compare it with the equivalent quarter a year earlier.
| Metric | Nvidia | AMD | Broadcom |
|---|---|---|---|
| Quarter ending | July 26, 2026 | Sept. 26, 2026 | Aug. 2, 2026 |
| Revenue | $96.221B | $13.377B | $29.591B |
| Revenue growth, year over year | 106% | 45% | 86% |
| Gross profit | $72.142B | $7.210B | $20.456B |
| GAAP gross margin | 75.0% | 53.9% | 69.1% |
| GAAP operating income | $63.734B | $2.832B | $15.955B |
| GAAP operating margin | 66.2% | 21.2% | 53.9% |
| GAAP diluted EPS | $2.46 | $1.46 | $2.68 |
Calculations: Gross margin = gross profit / revenue × 100. Operating margin = operating income / revenue × 100. For example, Nvidia’s operating margin = $63.734B / $96.221B × 100 = 66.2%. These margins describe one reported quarter, not a normalized annual run rate. Figures come from Nvidia’s earnings release, AMD’s earnings release, and Broadcom’s SEC Form 10-Q.
The difference in operating margins is substantial, but it is not a simple ranking of management quality. Nvidia’s exceptionally high volume of AI infrastructure sales spreads operating costs across a large revenue base. AMD is expanding across CPUs, GPUs, client devices, and embedded systems. Broadcom reports a combination of semiconductor solutions and infrastructure software with different economics.
2. Identify which business segments produce the growth
Nvidia: data center concentration
Nvidia reported approximately $89.0B in Data Center revenue, or about 92.5% of its $96.221B company revenue. The segment grew 117% year over year. That concentration makes AI infrastructure demand a central variable in forecasting Nvidia’s sales, pricing, inventory, and margins. It also means setbacks in data center spending could have an outsized effect on results. Source: Nvidia’s Q2 FY2027 report.
AMD: a changing revenue mix
AMD generated $8.546B in Data Center revenue, about 63.9% of total revenue, up 97% year over year. Client and Gaming contributed $3.722B, while Embedded contributed $1.109B. In an AMD model, track the Data Center business separately from PC, gaming, and embedded demand. A rising Data Center mix may support margins, but higher research costs, customer arrangements, or pricing pressure can offset that benefit. Source: AMD’s Q3 2026 segment tables.
Broadcom: semiconductors plus software
Broadcom recorded $20.839B of Semiconductor Solutions revenue (70% of total) and $8.752B of Infrastructure Software revenue (30%). The company also disclosed $16.7B in AI semiconductor revenue. That AI figure is a subset of its semiconductor activity, not a third segment to add to total revenue. Software subscriptions and semiconductor products have different recognition patterns and cost structures; compare their trajectories before applying a group-wide margin assumption. Sources: Broadcom’s quarterly release and Form 10-Q.
3. Test operating leverage and research spending
Operating leverage occurs when revenue increases faster than operating expenses, allowing operating profit to grow more quickly than sales. Divide research and development (R&D) spending by revenue to see how much of each sales dollar is being reinvested in engineering.
| R&D comparison, latest quarter | Nvidia | AMD | Broadcom |
|---|---|---|---|
| GAAP R&D expense | $7.054B | $2.803B | $2.895B |
| R&D / revenue | 7.3% | 21.0% | 9.8% |
Example: AMD’s R&D intensity = $2.803B / $13.377B × 100 = 21.0%. This is not automatically inefficient spending: a challenger may need to fund several product families before those investments generate sales. Likewise, Nvidia’s lower R&D-to-revenue ratio reflects its much larger current revenue base, not necessarily less technical ambition. These ratios can move sharply when sales rise faster than expense budgets.
4. Reconcile accounting profit with free cash flow
Net income is recorded under accrual accounting. Operating cash flow adjusts for noncash charges and changes in receivables, inventories, and payables. Free cash flow (FCF) then subtracts capital expenditures. See the free cash flow calculation guide for the underlying mechanics.
Basic formula: Free cash flow = operating cash flow − capital expenditures. Some issuers define FCF more broadly; Nvidia also subtracts principal payments related to property, equipment, and intangible assets. Use each company’s reconciliation and disclose any differences.
| Cash flow, latest quarter | Nvidia | AMD | Broadcom |
|---|---|---|---|
| Operating cash flow | $24.077B | $1.202B | $14.197B |
| Cash CAPEX | $2.677B | $0.648B | $0.532B |
| Additional Nvidia FCF deduction | $0.059B | Not applicable | Not applicable |
| Reported free cash flow | $21.341B | $0.554B | $13.665B |
| FCF margin (FCF / revenue) | 22.2% | 4.1% | 46.2% |
Worked calculations: Nvidia: $24.077B − $2.677B − $0.059B = $21.341B. AMD: $1.202B − $0.648B = $0.554B. Broadcom: $14.197B − $0.532B = $13.665B. The results use each company’s stated quarterly cash flow definition and exclude acquisitions, debt repayments, and share repurchases from CAPEX. Sources: Nvidia, AMD, and Broadcom.
Interpretation: Nvidia’s $59.688B GAAP net income exceeded its $24.077B operating cash flow partly because its cash flow statement showed a $22.346B outflow from receivables, a $5.784B outflow from inventory, and adjustments for noncash investment gains. This is a reason to examine payment terms and cash conversion, not proof that reported sales are invalid. AMD’s $0.554B FCF, compared with $2.428B net income, was pressured by working-capital movements including a $2.995B inventory outflow. Broadcom’s $13.665B quarterly FCF highlights strong cash conversion, although financing obligations and acquisition-related accounting must still be considered.
5. Analyze the balance sheets and liquidity
Look beyond the headline cash balance. Compare liquid resources with interest-bearing debt, then inspect inventory, accounts receivable, contractual commitments, and goodwill. Our balance sheet guide explains why this matters before valuing shares.
| Balance sheet snapshot | Nvidia | AMD | Broadcom |
|---|---|---|---|
| As of | July 26, 2026 | Sept. 26, 2026 | Aug. 2, 2026 |
| Cash and selected liquid debt securities / short-term investments | $56.586B | $15.776B | $23.975B cash only |
| Interest-bearing debt (carrying amount) | $33.366B | $7.079B | $59.419B |
| Inventories | $31.575B | $11.463B | $4.523B |
Important limits: Nvidia’s liquid-resource figure includes cash and marketable debt securities but excludes equity securities, some of which have sale restrictions. AMD’s figure combines cash and short-term investments. Broadcom’s figure is cash and cash equivalents. This is a liquidity screen, not a standardized net-debt metric, and the figures come from different balance sheet dates. Sources: Nvidia 10-Q, AMD 10-Q, and Broadcom 10-Q.
Nvidia: Accounts receivable reached $63.059B and inventories $31.575B at July 26, compared with $38.466B and $21.403B at its January 25 fiscal year-end. Rapid sales growth can require additional working capital. Examine collection periods, customer concentration, and supply agreements rather than treating every increase as a warning sign.
AMD: Inventories rose to $11.463B from $7.920B at the prior fiscal year-end. Check whether inventory growth is supported by committed orders, product ramps, and realistic delivery schedules.
Broadcom: Its $59.419B debt carrying value and substantial goodwill and acquired intangible assets make interest costs and acquisition economics especially relevant. GAAP assets included $97.801B of goodwill and $26.325B of intangibles at August 2. These amounts do not represent cash available to repay debt.
6. Understand GAAP versus non-GAAP EPS
Non-GAAP figures can help isolate recurring operating trends, but each company chooses its adjustments. Stock-based compensation is a real cost to shareholders through dilution even when excluded from an adjusted profit measure. Acquisition-related amortization may be noncash in the current period but can reflect a genuine historical purchase price.
| Latest quarter diluted EPS | GAAP | Non-GAAP |
|---|---|---|
| Nvidia | $2.46 | $2.22 |
| AMD | $1.46 | $2.09 |
| Broadcom | $2.68 | $3.32 |
Nvidia’s GAAP EPS was higher than adjusted EPS in this quarter, illustrating why adjusted earnings are not automatically larger. Nvidia reported investment-related gains, and beginning with fiscal 2027 its non-GAAP presentation no longer excludes stock-based compensation. AMD’s and Broadcom’s adjustments follow different policies. Compare each reconciliation, not the dollar amount of EPS across companies, which also depends on share count.
7. Use stock charts as context, not proof of financial quality
Price and volume charts show how market participants traded each stock, but price moves cannot by themselves establish whether revenue quality, earnings quality, or valuation improved. The following daily charts were captured on November 9, 2026, at 21:54 CET, during the U.S. trading day. The final daily candles are incomplete intraday observations, not verified closing prices.
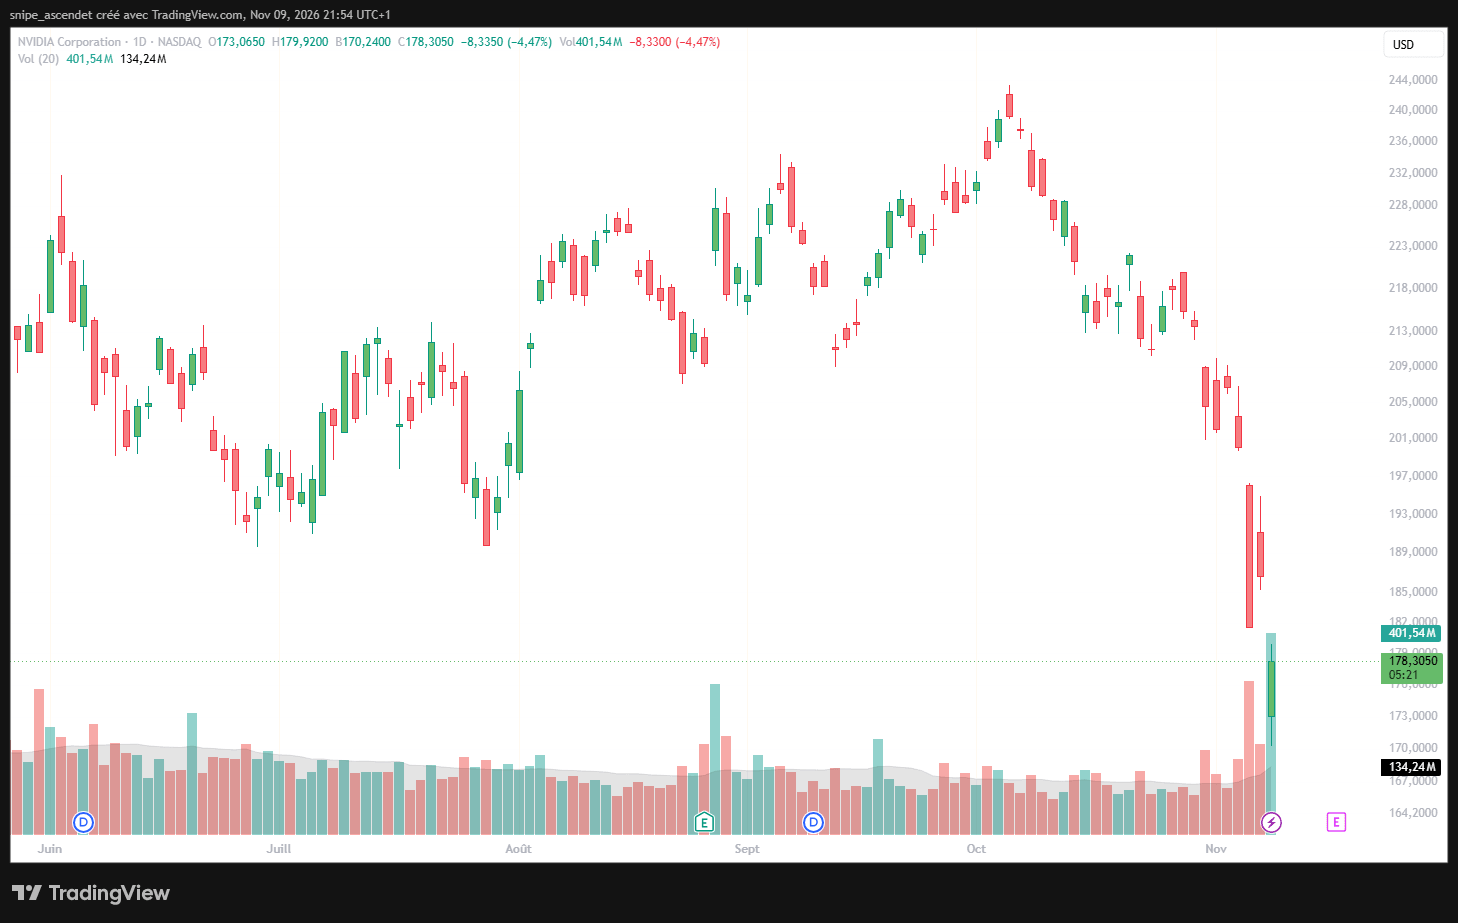
Nvidia announced these financial results on August 26. The chart is useful for examining broader price movement and trading volume around that release, without assigning later price changes to one cause.
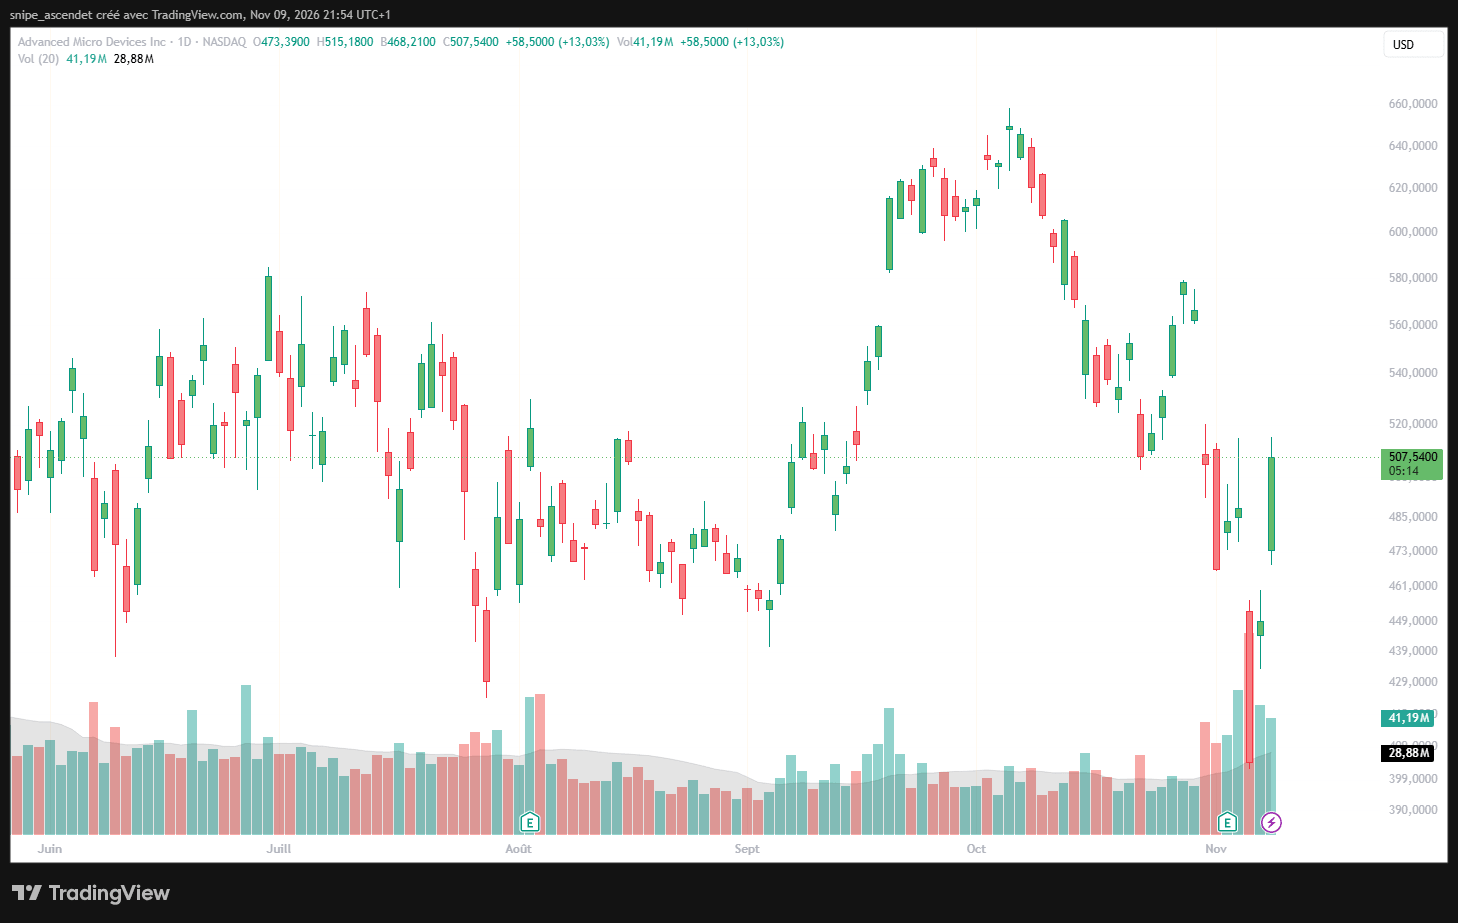
AMD reported on November 3. Examine subsequent changes in volume alongside guidance, expectations, and market conditions; a single trading session does not isolate the effect of the earnings report.
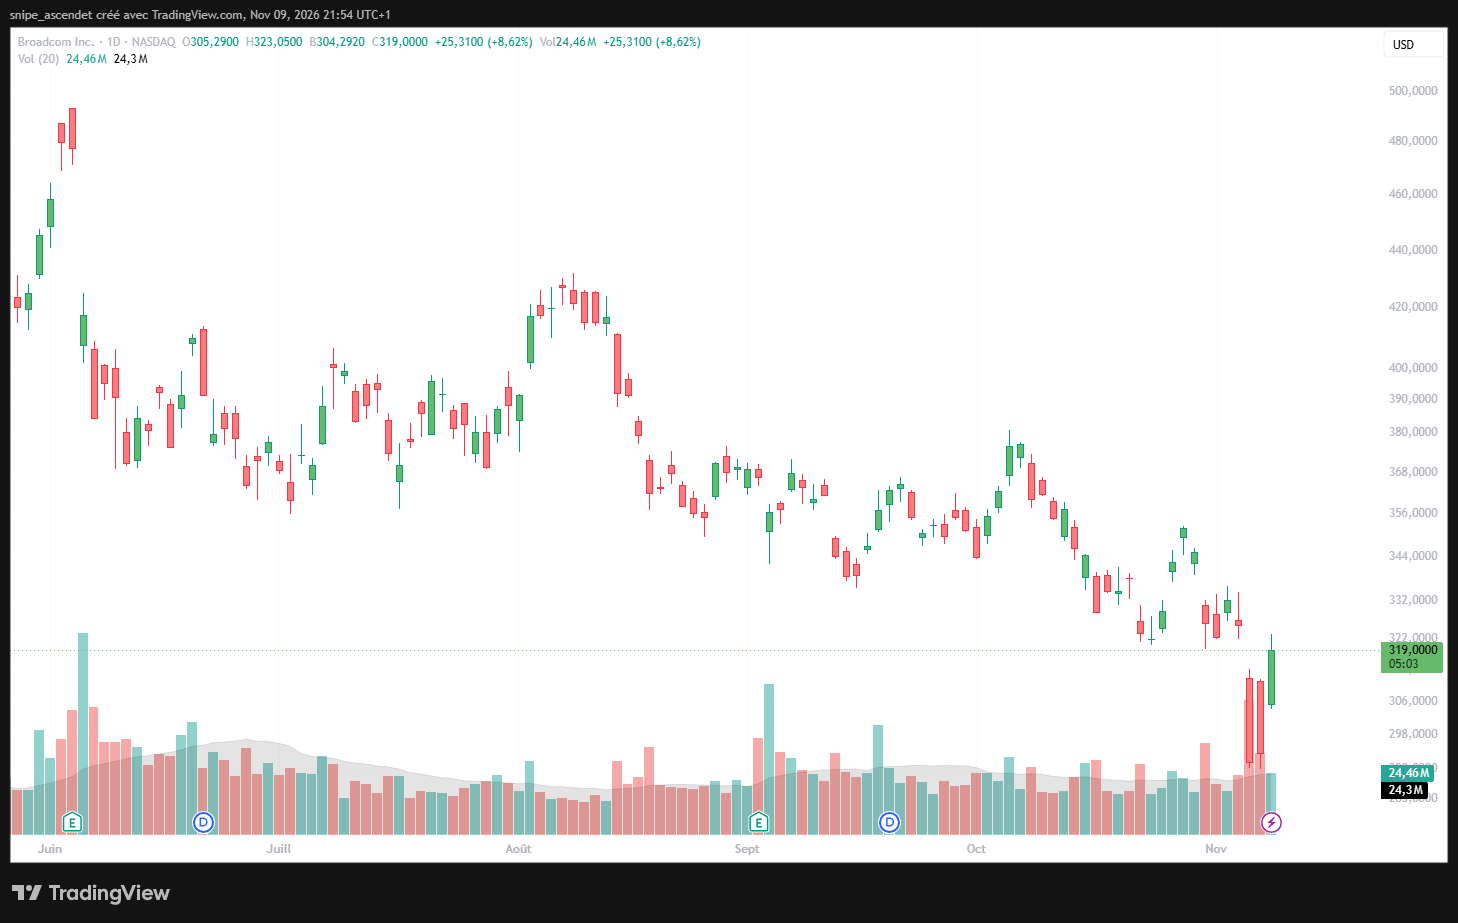
Broadcom announced its fiscal Q3 results on September 2. The price chart provides market context, while its cash flow, leverage, and software-versus-chip mix still require analysis from filings.
8. A practical checklist for your own semiconductor analysis
- Verify periods: Confirm quarter-end dates, reporting currencies, GAAP status, and any changes in segment definitions.
- Model the segments: Separate data center, client, embedded, semiconductor solutions, and infrastructure software as applicable.
- Measure margins: Calculate gross margin, operating margin, and R&D intensity; explain changes in product mix.
- Reconcile cash: Start with operating cash flow, subtract the correct capital spending, and analyze receivables and inventories.
- Stress-test the balance sheet: Compare cash, investments, debt maturities, acquisition intangibles, and off-balance-sheet or purchase commitments.
- Check valuation separately: Financial strength is not a stock purchase signal without comparing expectations and price. Use the quarterly earnings red-flags guide to review surprises and disclosure quality.
What the comparison tells investors
Nvidia leads this particular quarter in GAAP operating margin and absolute revenue, AMD is rapidly expanding its Data Center business while spending heavily on R&D, and Broadcom combines semiconductor growth with substantial software exposure and strong reported free cash flow. None of those observations alone identifies the best-valued stock.
The central lesson: Strong sales are only the first step. A sound semiconductor analysis explains who is buying the products, whether revenue generates durable profit and cash, what capital is tied up along the way, and how financial obligations and valuation affect the potential shareholder outcome.
Educational information only. Historical reported figures are not forecasts or personalized investment advice. Company guidance and market prices can change.