


Operating leverage explains why a company’s operating profit can rise much faster than its revenue. When a business has meaningful fixed costs, additional sales can spread those costs across more units. If variable costs and prices remain stable, a larger share of each new dollar of revenue becomes operating income. The same mechanism works in reverse: when sales fall, profits can fall even faster.
For investors and financial analysts, operating leverage is a way to understand profit margins, forecast earnings, and assess business risk. It is not the same as using borrowed money.
What Is Operating Leverage?
Operating leverage measures how sensitive operating income is to changes in sales. Operating income is the profit from business operations after operating costs, including depreciation where applicable, but before financing costs and income taxes. It is often close to earnings before interest and taxes (EBIT), although the definitions can differ when nonoperating items are involved.
The mechanism depends on how costs behave:
- Fixed costs: Costs that remain approximately unchanged across a relevant range of activity, such as a factory lease, certain salaried staff, and equipment depreciation.
- Variable costs: Costs that generally rise with sales or production, such as materials, per-unit fulfillment, or sales commissions.
- Contribution margin: Revenue minus variable costs. This amount first covers fixed costs; any remainder becomes operating profit in a simplified model.
A company with substantial fixed costs and relatively low variable costs typically has greater operating leverage. For a useful foundation, see our worked break-even analysis, which explains how fixed costs and contribution margin determine the sales needed to avoid an operating loss.
Operating Leverage Formula
The degree of operating leverage (DOL) measures the percentage response in operating income to a percentage change in revenue:
DOL = Percentage change in operating income / Percentage change in revenue
In a simple single-product cost model, at a specific sales level, it can also be calculated as:
DOL = Contribution margin / Operating income
Where:
- Contribution margin = Revenue − Variable costs, measured in dollars.
- Operating income = Revenue − Variable costs − Fixed costs, measured in dollars.
- DOL is a dimensionless multiple, not a dollar amount.
The contribution-margin formula estimates sensitivity around the current sales level when selling prices, variable cost per dollar of sales, and fixed costs stay unchanged. The percentage-change formula can describe observed results between reporting periods, but those results may also reflect pricing, product mix, acquisitions, or one-time charges. They are not automatically a pure measure of structural operating leverage. OpenStax provides an accessible accounting explanation of operating leverage and the fixed-cost assumptions behind it.
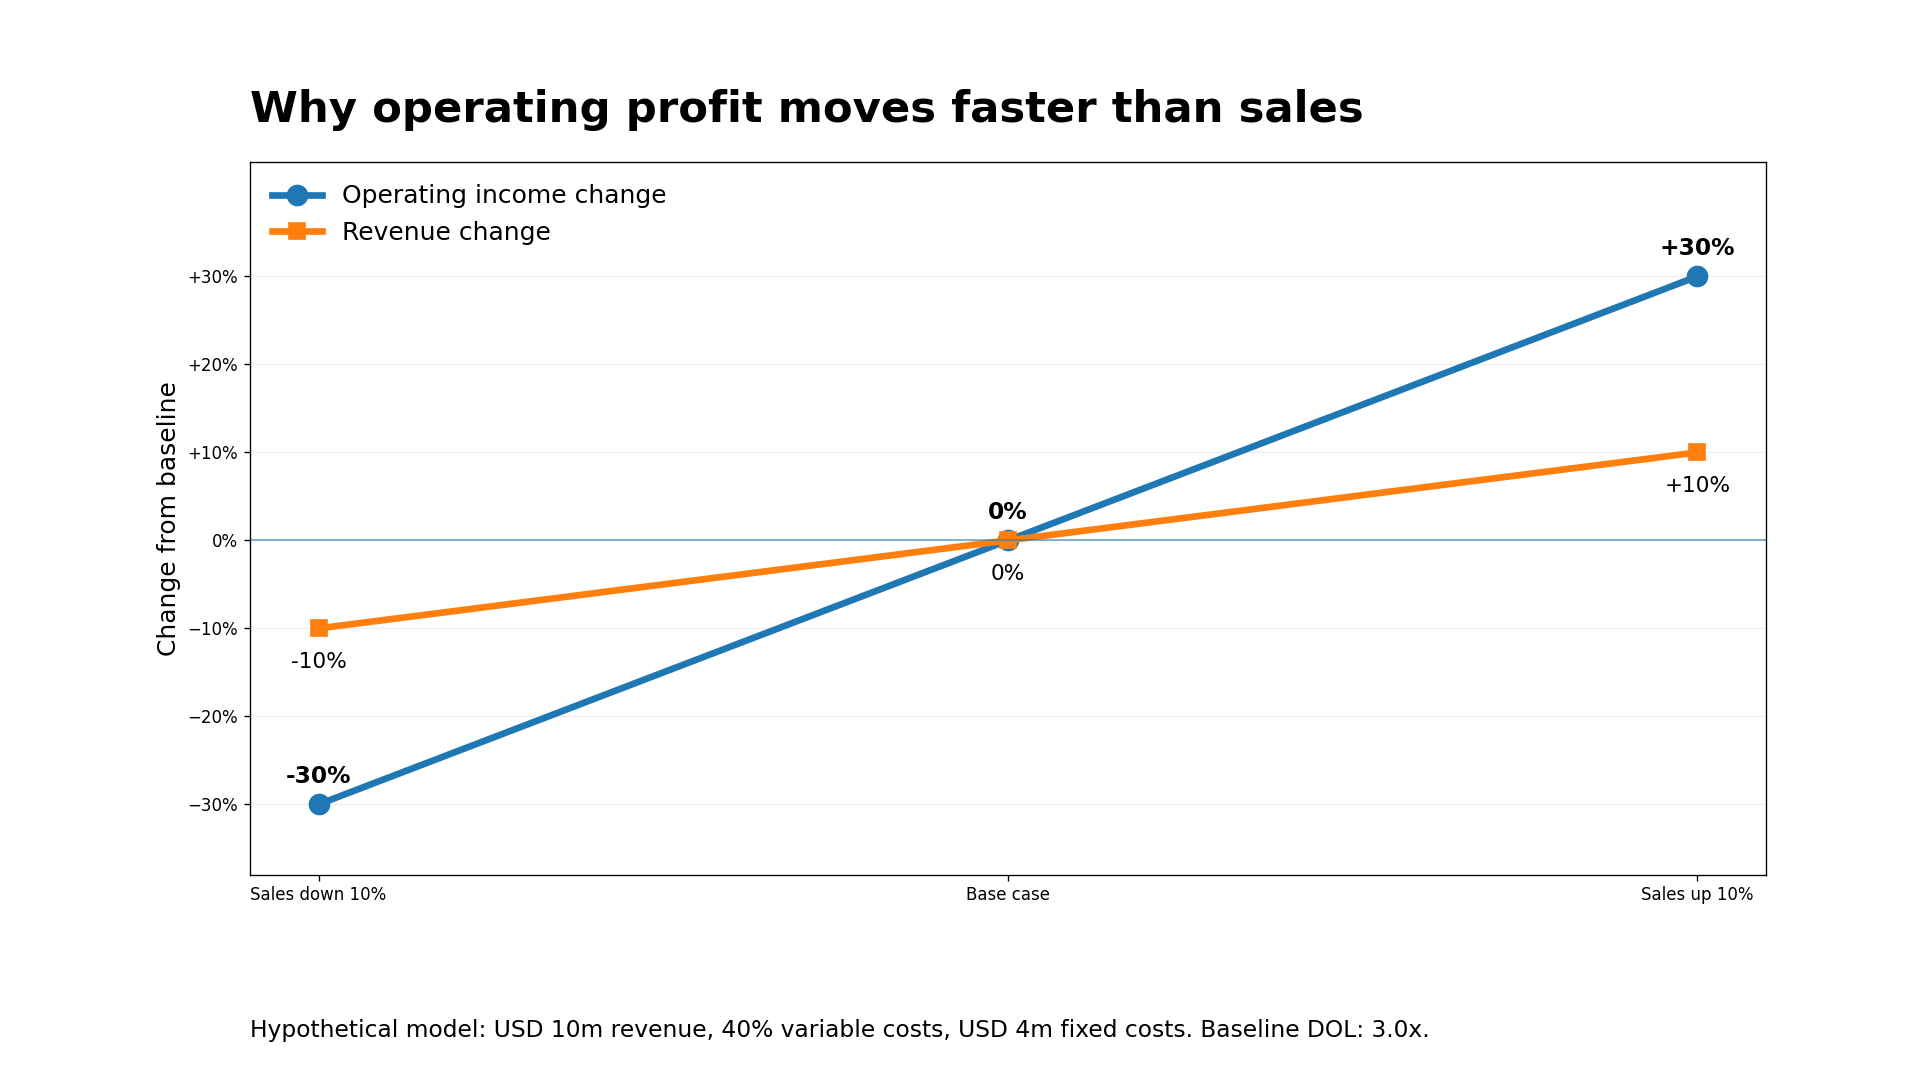
Worked Example: A 10% Sales Increase Produces 30% Profit Growth
Assume a hypothetical manufacturing company generates $10 million in annual revenue, incurs variable costs equal to 40% of sales, and pays $4 million in fixed operating costs. This is an educational model, not an actual company’s financial statement.
| Financial measure | Base case | Sales rise 10% | Sales fall 10% |
|---|---|---|---|
| Revenue | $10.0 million | $11.0 million | $9.0 million |
| Variable costs (40% of revenue) | $4.0 million | $4.4 million | $3.6 million |
| Contribution margin | $6.0 million | $6.6 million | $5.4 million |
| Fixed operating costs | $4.0 million | $4.0 million | $4.0 million |
| Operating income | $2.0 million | $2.6 million | $1.4 million |
| Operating margin | 20.0% | 23.6% | 15.6% |
| Operating income change | Base | +30% | −30% |
Step 1: Calculate the baseline operating income. Revenue of $10.0 million minus $4.0 million in variable costs minus $4.0 million in fixed costs equals $2.0 million in operating income.
Step 2: Calculate the baseline DOL. The $6.0 million contribution margin divided by $2.0 million operating income gives a DOL of 3.0.
Step 3: Apply a 10% revenue increase. Revenue increases to $11.0 million, variable costs to $4.4 million, and fixed costs remain at $4.0 million. Operating income becomes $2.6 million, a 30% increase from $2.0 million.
Step 4: Test the downside. With revenue down 10% to $9.0 million and unchanged cost behavior, operating income drops to $1.4 million, or 30% below the starting level.
This 3.0x relationship works for these scenarios only because the model holds cost behavior, selling prices, and production capacity constant. In a real business, overtime, discounts, additional facilities, and inflation may change the result.
High vs. Low Operating Leverage: Why Business Models Matter
Two businesses can report the same starting revenue and operating profit yet react differently to a sales change.
| Hypothetical measure | Higher leverage | Lower leverage |
|---|---|---|
| Starting revenue | $10.0 million | $10.0 million |
| Variable costs | $4.0 million | $7.0 million |
| Fixed costs | $4.0 million | $1.0 million |
| Starting operating income | $2.0 million | $2.0 million |
| Degree of operating leverage | 3.0x | 1.5x |
| Profit growth if revenue rises 10% | +30% | +15% |
| Profit decline if revenue falls 10% | −30% | −15% |
An automated manufacturer may invest heavily in equipment before selling its first unit. A software platform may invest in development, engineers, and infrastructure before subscription revenue scales. By contrast, a distributor or labor-intensive service provider may incur more costs each time it makes an additional sale.
These are tendencies, not fixed industry rules. Cloud computing expenses, customer support, sales commissions, and new hiring can make software costs variable or step up over time. What matters is the actual cost structure, not the industry’s reputation.
Real Company Example: NVIDIA’s Fiscal 2025 Operating Profit
NVIDIA provides a useful historical example of operating income growing faster than sales. According to its February 26, 2025 fiscal-year results, the company’s U.S. GAAP figures were:
| NVIDIA GAAP measure | Fiscal 2024 | Fiscal 2025 | Year-over-year change |
|---|---|---|---|
| Revenue | $60.922 billion | $130.497 billion | +114.2% |
| Operating income | $32.972 billion | $81.453 billion | +147.0% |
| Operating margin | 54.1% | 62.4% | +8.3 percentage points |
NVIDIA’s operating income grew faster than its revenue, and its operating margin widened. Dividing the approximately 147.0% operating-income growth by 114.2% revenue growth produces an observed growth ratio of about 1.29x.
That historical ratio does not establish NVIDIA’s theoretical DOL. The company also reported an improvement in GAAP gross margin from 72.7% to 75.0%, so pricing, product mix, sales volume, and other changes can influence the observed result. The published income statement does not separate all costs into the fixed and variable categories needed for a precise structural DOL calculation.
The practical lesson is to distinguish a reported increase in operating margin from a forecast that fixed costs will remain constant. For a broader review of what to check in company filings, see our guide on reading quarterly earnings reports.
How Investors Can Use Operating Leverage
Operating leverage becomes useful when analyzing the durability of earnings growth rather than just the latest percentage change.
Look for improving operating margins. Calculate operating margin as operating income divided by revenue. If revenue rises faster than operating costs, margins may expand. But verify whether the improvement comes from scalable operations, favorable pricing, or temporary savings.
Build upside and downside cases. In a forecast, change sales volume and explicitly model variable costs, headcount, capacity, and other step-fixed expenses. Do not assume the same DOL applies indefinitely. Analysts can incorporate these assumptions into a discounted cash flow valuation to test how operating margins affect projected cash flows and business value.
Check the distance to break-even. In our hypothetical example, contribution margin is 60% of sales. The operating break-even revenue is therefore $4.0 million / 60% = approximately $6.67 million. As operating income approaches zero, DOL can become extremely large or undefined, making the ratio unstable.
Compare profit with cash generation. High operating profits do not guarantee high free cash flow. An equipment-heavy business can need substantial capital expenditures, while working-capital movements can absorb cash. Our free cash flow guide explains the difference between operating profitability and cash available after capital spending.
Common Mistakes and Limitations
- Confusing operating leverage with financial leverage. Operating leverage concerns the cost structure of operations. Financial leverage concerns borrowing and financing obligations.
- Assuming every fixed cost stays fixed. Fixed costs can rise when capacity, employee count, rent, or technology requirements change. Analysts should define the relevant sales range and forecast period.
- Treating every expense as clearly fixed or variable. Some costs are mixed, contract-based, or step-fixed. Public financial statements rarely provide a complete cost-behavior breakdown.
- Calling the historical growth ratio a permanent DOL. One-time charges, acquisitions, restructuring, pricing changes, and shifts in product mix can distort year-over-year comparisons.
- Using DOL without checking the profit base. Near break-even, or when operating income is zero or negative, the standard multiplier can be misleading or economically difficult to interpret.
Key Takeaways
Operating leverage is the reason a 10% rise in sales can produce a much larger rise in operating income. In a simple model, its degree equals contribution margin divided by operating income. It rewards growing volume when fixed costs can be spread over more sales, but it amplifies profit declines during slowdowns.
For investors, the right question is not simply whether profits grew faster than revenue. It is why they grew faster, whether the cost advantage can last, and what happens to margins if demand disappoints. Operating leverage is a tool for understanding both opportunity and risk, not a standalone stock-selection signal.