

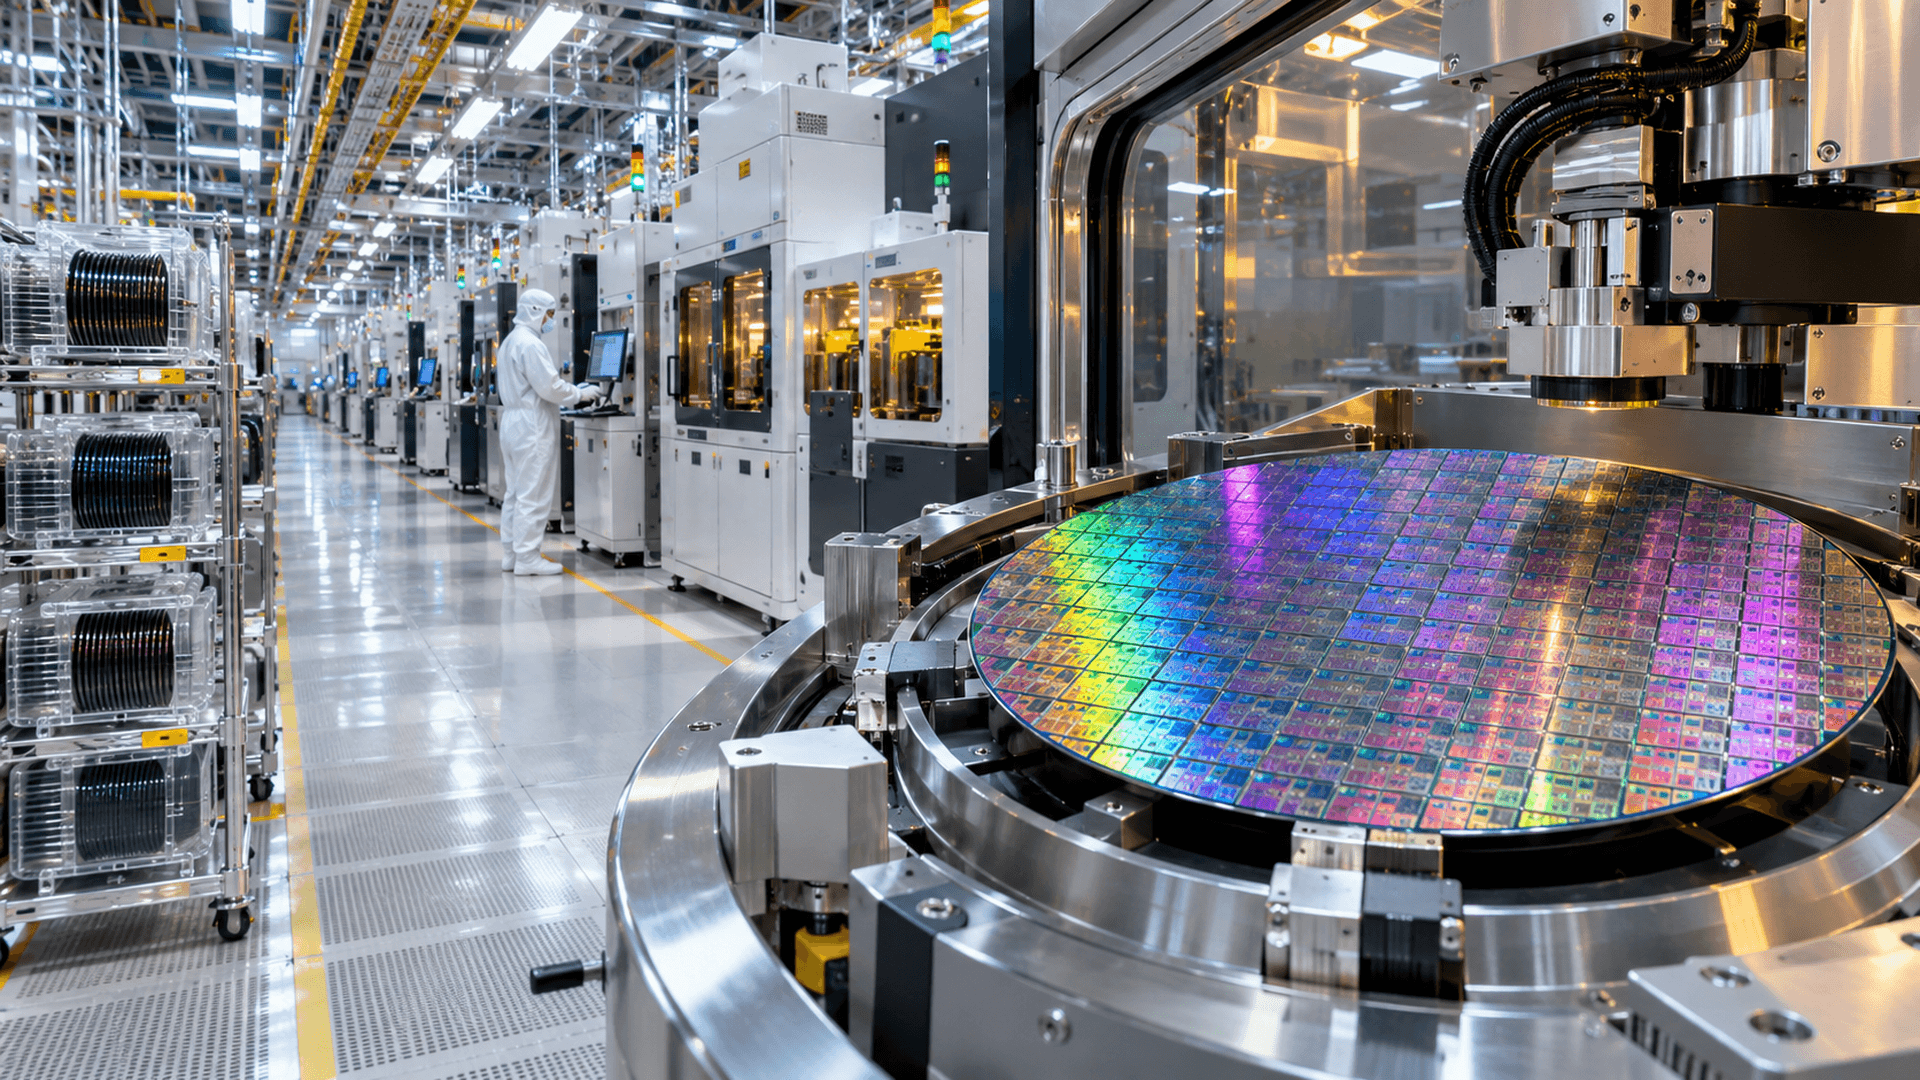
The semiconductor cycle is the recurring expansion and contraction of chip demand, inventory, production, and capital spending. It happens because customers can change orders quickly, while chipmakers need time and substantial investment to adjust manufacturing capacity. To understand where a company may be in that cycle, analyze revenue, inventory, and capital expenditures (CapEx) together, then check pricing, utilization, and cash flow.
Why Does the Semiconductor Industry Move in Cycles?
Semiconductors are used in smartphones, PCs, cars, industrial equipment, cloud servers, and AI systems. When customers expect stronger sales, they order more chips. Manufacturers respond by raising output and, eventually, investing in more capacity. But a new fabrication plant (fab) or production line cannot be built overnight.
If demand slows before supply adjusts, unsold chips accumulate, orders are cut, and factories operate below efficient capacity. Lower utilization can pressure gross margins because depreciation and other fixed manufacturing costs remain significant. Production cuts and inventory reductions eventually help restore balance.
The historical swings are substantial. According to the Semiconductor Industry Association, global chip sales fell from $574.1 billion in 2022 to $526.8 billion in 2023. Revised industry data put 2024 sales at $630.5 billion. Finalized World Semiconductor Trade Statistics (WSTS) figures reported $795.6 billion in 2025. These are annual industry sales, not stock-market returns, and growth varied sharply across chip categories.
The Four Phases of a Typical Semiconductor Cycle
| Phase | Revenue and pricing | Inventory | CapEx and capacity |
|---|---|---|---|
| Recovery | Orders and selling prices stabilize or improve | Excess stock starts to clear | Spending may remain cautious |
| Expansion | Shipments increase and margins often strengthen | Stock rebuilds to support demand | Equipment orders and expansion plans rise |
| Oversupply | Revenue growth slows; pricing can weaken | Customers and manufacturers hold too much stock | Projects may still be completing |
| Correction | Orders, sales, and margins weaken | Production cuts and write-downs may follow | New investment is delayed or reduced |
This is a framework, not a fixed timetable. Different product markets can be in different phases simultaneously. Strong demand for AI accelerators or high-bandwidth memory (HBM) does not guarantee strength in automotive microcontrollers, analog chips, or consumer storage.
Revenue: Separate Chip Demand From Inventory Replenishment
Revenue is the first visible signal, but it is not a direct measurement of how many chips end users consume. A semiconductor company’s shipments may rise because customers are rebuilding previously depleted inventories, not because final demand is accelerating at the same rate. Conversely, customer inventory reductions can depress chip orders even when sales of finished products are relatively stable.
When analyzing a revenue change, ask three questions:
- Volume: Did the company sell more units, wafers, or memory bits?
- Pricing: Did average selling prices (ASPs) increase or decline?
- Mix: Did the business sell a larger share of higher-value products?
Memory producers can experience large changes in revenue and gross margin as DRAM or NAND pricing shifts. Fabless designers, such as Nvidia and AMD, rely on manufacturing partners, so their revenue profile and direct factory CapEx differ from those of integrated manufacturers. Equipment suppliers, such as Lam Research or Applied Materials, are affected by customers’ fabrication spending rather than only current chip shipments.
Inventory: The Signal That Can Reveal a Turning Point
Inventory includes raw materials, work in process, and finished goods. Analysts should distinguish a chipmaker’s own reported inventory from customer inventory, distributor inventory, and inventory inside the broader supply chain. One balance-sheet figure cannot capture all four.
Rising inventory can indicate planned product launches, a transition toward more complex chips, or insufficient demand. Read management’s explanation and compare several quarters. In particular, look for finished-goods accumulation, longer customer digestion periods, manufacturing underutilization, and inventory write-downs.
A useful metric is days inventory outstanding (DIO):
DIO (days) = Average inventory (USD) ÷ Cost of goods sold for the period (USD) × Number of days in that period
For an annual approximation, use 365 days. Average inventory normally equals beginning inventory plus ending inventory, divided by two. Both inventory and cost of goods sold must use the same currency and unit scale; use the annual cost of goods sold when using 365 days.
DIO estimates how many days of production cost are tied up in inventory. A higher figure can indicate slower turnover, but changes in product mix, production lead times, accounting write-downs, and strategic buffers can also affect it. Compare a company with its own history before comparing firms with different business models. For an overview of inventory and other balance-sheet risks, see our guide to analyzing a balance sheet before buying a stock.
CAPEX: Why Investment Decisions Can Amplify the Cycle
CapEx is cash spent on long-lived assets such as cleanroom buildings, processing tools, and manufacturing infrastructure. It is especially important for memory manufacturers and foundries. A fabless designer may instead have relatively low direct manufacturing CapEx while committing to purchases or capacity from suppliers.
There is a timing mismatch. Companies often approve expansion when demand and prices look attractive, but production capacity may arrive after market conditions change. If several manufacturers expand together, excess capacity can later pressure utilization and pricing. This also explains why semiconductor equipment companies can have a cycle that differs from the cycle in chip revenue.
More CapEx is not automatically bad. It may be needed to move to advanced process nodes, add HBM capacity, replace aging equipment, or relieve a genuine bottleneck. The key questions are whether future demand can absorb the capacity, what returns the investment may earn, and how the company will finance it. Our free cash flow guide explains how investment spending affects cash generation.
Real-World Example: Micron’s 2023–2025 Recovery
Micron Technology (NASDAQ: MU), a major DRAM and NAND producer, provides a useful historical case study. The figures below come from its FY2025 Form 10-K and FY2024 Form 10-K. Fiscal years ended in late August; they do not match calendar years. Dollar figures are USD billions unless otherwise specified.
| Metric | FY2023 | FY2024 | FY2025 |
|---|---|---|---|
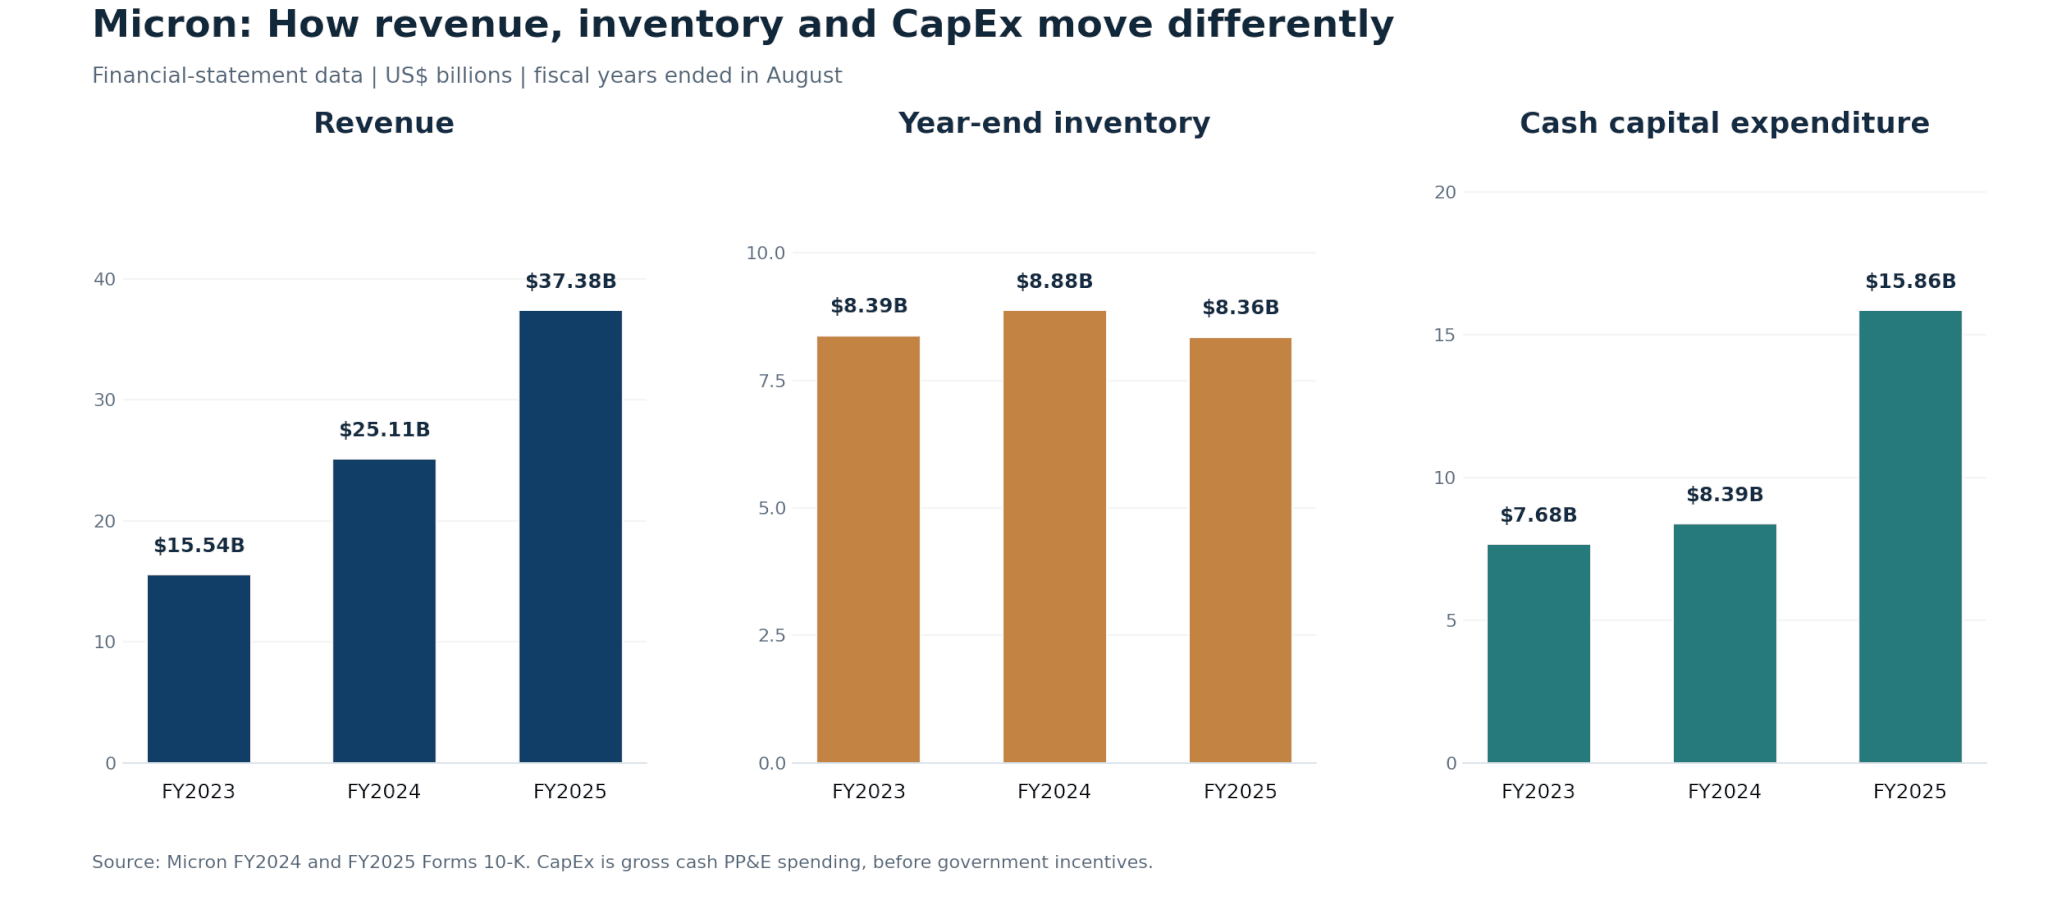
| Revenue | $15.540B | $25.111B | $37.378B |
| GAAP gross margin | −9.1% | 22.4% | 39.8% |
| Year-end inventory | $8.387B | $8.875B | $8.355B |
| Operating cash flow | $1.559B | $8.507B | $17.525B |
| Cash PP&E expenditures (gross CapEx) | $7.676B | $8.386B | $15.857B |
| Simplified FCF, before investment grants | −$6.117B | $0.121B | $1.668B |
Micron’s revenue increased approximately 61.6% in FY2024 and 48.9% in FY2025, while its gross margin recovered from a FY2023 loss-making level. The company reported approximately $1.83 billion of inventory write-down charges in FY2023, demonstrating that excess or lower-value inventory can directly affect reported profitability. Its inventory balance subsequently declined between FY2024 and FY2025, even as cash capital spending increased sharply.
Calculate Micron’s Inventory Days
The variables are ending inventories (USD millions), annual cost of goods sold (USD millions), and 365 days. All inputs are historical GAAP financial-statement figures.
- FY2024: Average inventory = ($8,387M + $8,875M) ÷ 2 = $8,631M. DIO = $8,631M ÷ $19,498M × 365 = 161.6 days.
- FY2025: Average inventory = ($8,875M + $8,355M) ÷ 2 = $8,615M. DIO = $8,615M ÷ $22,505M × 365 = 139.7 days.
The roughly 21.9-day decline suggests faster inventory turnover on this accounting measure. It does not prove the supply chain was fully balanced. Inventory is recorded at cost and can be affected by write-downs, product shifts, and manufacturing changes.
For cash flow, a simple FY2025 calculation is $17.525B in operating cash flow − $15.857B in gross cash PP&E spending = $1.668B. This deliberately uses gross cash expenditure; Micron separately reported government incentive proceeds, so its company-defined adjusted free cash flow can differ. Do not mix gross and net CapEx measures without reconciling the definition.
How to Read the Cycle in a 10-K or Earnings Release
| Indicator | Possible improvement | Potential warning |
|---|---|---|
| Revenue and ASP trends | Sustained demand and better prices | Growth led only by a short inventory refill |
| DIO and inventory mix | Faster turnover, fewer write-downs | Finished goods accumulating faster than sales |
| Gross margin and utilization | Plants absorb fixed costs more efficiently | Idle capacity and inventory charges |
| CapEx versus operating cash flow | Investment supported by stronger cash generation | Expansion requires persistent external funding |
| Customer order patterns | Broad orders and manageable lead times | Cancellations, double ordering, weak end demand |
| Management commentary | Multiple segments confirm recovery | One booming product masks weakness elsewhere |
Read at least eight quarters when possible, ideally across more than one full cycle. Start with the audited income statement, balance sheet, and cash flow statement; then examine management’s discussion of inventory, pricing, capacity, and capital commitments. Our guides to reading a Form 10-K and spotting quarterly earnings red flags explain where to find the evidence.
Common Mistakes When Analyzing Semiconductor Stocks
Treating all chip companies as identical is a major analytical error. Memory, analog, logic, foundries, and equipment each have different economics. Other mistakes include interpreting rising inventory as automatically negative, confusing capital spending with depreciation, assuming strong chip demand immediately translates into equipment revenue, or projecting peak-cycle gross margins indefinitely.
Valuation also matters. Earnings can look unusually cheap at the top of a profit cycle and unusually expensive at the bottom. A stock can decline during a business recovery if expectations were even higher. Cycle analysis identifies financial conditions; it does not reliably predict a share-price turning point.
Key Takeaways
The semiconductor cycle links changing orders, selling prices, inventory, factory utilization, and delayed capital investment. Revenue shows current sales, inventory helps reveal supply-demand imbalances, and CapEx shows how companies are preparing future capacity. The strongest analysis combines all three with margins, cash flow, and management’s product-level explanations. Micron’s 2023–2025 figures show why these indicators should be read together rather than in isolation.
Educational note: Micron data in this example covers FY2023–FY2025 and is historical, not a current-quarter forecast. Industry sales are separate calendar-year series. This article is for financial education and is not personalized investment advice.