


The 10-year Treasury yield is the annualized market yield associated with U.S. government debt that has approximately ten years remaining to maturity. It is one of the most closely watched interest-rate benchmarks because it influences the pricing of other bonds, mortgage borrowing, and the discount rates investors use to value companies. It is not the Federal Reserve’s policy rate, nor is it the fixed coupon paid by every 10-year Treasury note.
For context, the U.S. Treasury’s daily par yield curve reported a 10-year yield of 4.86% on November 6, 2026. That is a dated market observation, not a permanent interest rate or a quote available on every bond.
What Exactly Does the 10-Year Treasury Yield Measure?
The U.S. government borrows by selling Treasury securities. A 10-year Treasury note is a marketable debt security with an original term of ten years. According to TreasuryDirect, the note pays a fixed coupon every six months and returns its face value at maturity, assuming scheduled payments are made.
Three terms are worth separating:
- Face value (principal): the amount repaid when the note matures, such as $1,000 in our hypothetical example.
- Coupon rate: the note’s fixed annual interest rate, which determines the cash interest payments. A 4% coupon on $1,000 pays $40 per year, typically $20 every six months.
- Yield to maturity: the discount rate that equates the note’s remaining promised payments with its current market price. It changes when the price changes, even though the coupon does not.
The widely quoted daily 10-year benchmark is usually a constant-maturity yield derived from a fitted Treasury par yield curve. It represents an estimated par yield at precisely ten years, rather than the executable yield on one specific note. The Federal Reserve’s DGS10 series tracks this daily benchmark.
Why Do Bond Prices Fall When Treasury Yields Rise?
When newly available securities offer more attractive yields, an older lower-coupon note generally must trade at a discount to compete. Conversely, if market yields fall, the fixed payments on an existing note become more valuable. The U.S. Treasury’s pricing guide confirms this inverse relationship.
Worked Example: A 4% Coupon Note When the Market Requires 5%
Suppose an investor holds a hypothetical 10-year note with $1,000 face value, a fixed 4% annual coupon and exactly ten years remaining. It makes 20 semiannual payments of $20, then repays $1,000 at maturity. Ignore accrued interest, transaction costs and taxes.
Variables and units: C = $20 per six months; F = $1,000 principal; n = 20 six-month periods; y = annualized nominal yield expressed as a decimal. The bond-pricing formula is:
Price = Σ [C ÷ (1 + y/2)^t], for t = 1 through 20, + F ÷ (1 + y/2)^20.
At a 4% required yield, the note is worth $1,000. At a 5% required yield, discounting the same payments at 2.5% per half-year gives $922.05, a decline of 7.79%. The issuer still promises the same $20 semiannual coupon. The market price, not the coupon, absorbs the higher required return.
| Required annual yield | Hypothetical note price | Interpretation |
|---|---|---|
| 3.0% | $1,085.84 | Above face value (premium) |
| 4.0% | $1,000.00 | At face value (par) |
| 5.0% | $922.05 | Below face value (discount) |
| 6.0% | $851.23 | Larger discount |
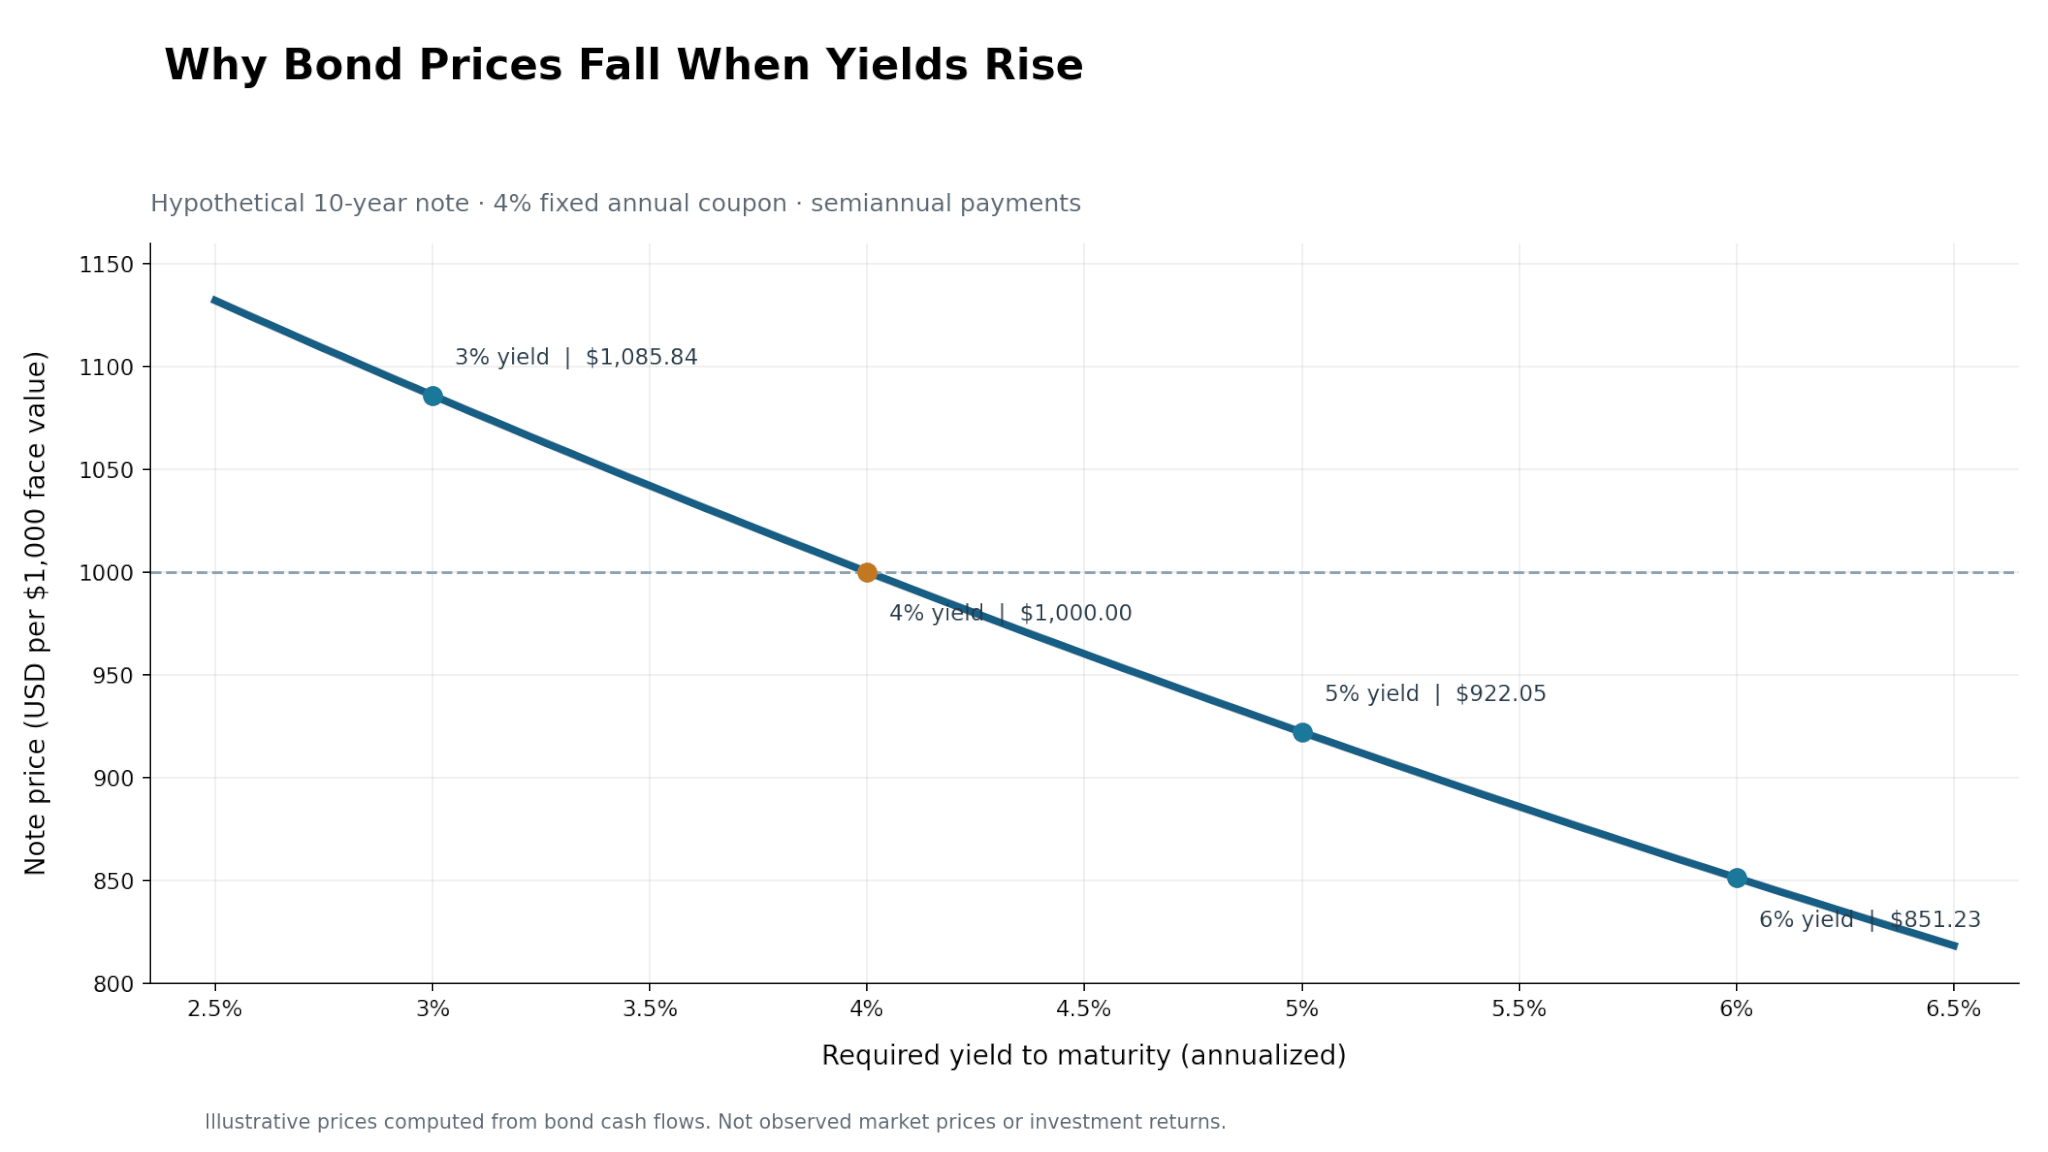
Interpretation: Longer-maturity fixed-rate securities tend to be more sensitive to yield changes than otherwise comparable short-maturity securities. Investors who sell before maturity face interest-rate risk. An investor who holds a conventional note to maturity still receives its scheduled nominal principal and coupon payments, but can experience inflation and reinvestment risk. The example assumes the government makes all payments as promised.
What Makes the 10-Year Treasury Yield Move?
The yield reflects several forces, so a rise or fall does not have only one possible meaning.
| Driver | How it can affect the 10-year yield |
|---|---|
| Expected inflation | Higher expected inflation may raise the nominal return investors demand. |
| Expected Federal Reserve policy | Expectations for future short-term rates influence longer-term yields, though the Fed does not directly set the 10-year yield. |
| Economic growth | Stronger growth and borrowing demand can push yields higher; weaker growth can pull them lower. |
| Term premium | Investors may demand extra compensation for the uncertainty of owning long-maturity bonds. |
| Treasury supply and investor demand | Heavy issuance, changes in risk appetite and purchases by institutions can move prices and yields. |
A useful conceptual decomposition is long-term Treasury yield ≈ expected average future short-term rates + term premium. The Federal Reserve Bank of New York explains that term premium is not directly observed and must be estimated. The components are not a simple daily attribution formula, and inflation expectations affect both nominal short-rate expectations and required compensation.
This is why a Federal Reserve rate cut does not guarantee a lower 10-year yield. If investors simultaneously anticipate stronger inflation or demand a larger term premium, longer-term yields can rise.
Why Does the 10-Year Treasury Yield Matter for Stocks?
The 10-year yield is often used as a reference for the risk-free rate in long-horizon valuation models, although U.S. Treasuries remain exposed to market-price and inflation risks. Investors generally require some additional expected compensation, called an equity risk premium, to own stocks instead of relatively low-credit-risk government securities.
In a common cost-of-equity model, cost of equity = risk-free rate + beta × equity risk premium. A higher Treasury yield can raise the discount rate used to value future corporate cash flows, all else equal. This affects companies whose expected profits arrive far in the future particularly strongly. For an applied model, see our guide to valuing a stock with discounted cash flow.
Consider a separate hypothetical investment expected to pay $100 exactly ten years from now, with no earlier distributions. The present-value formula is PV = $100 ÷ (1 + r)^10, where r is the annual discount rate:
- At 8%, present value = $46.32.
- At 9%, present value = $42.24.
- Increasing the assumed discount rate by one percentage point reduces the modeled present value by approximately 8.81%.
This isolates a discount-rate effect; it does not predict a stock-market return. A one-point increase in the 10-year yield does not automatically imply a one-point increase in a company’s cost of equity or WACC. Expected earnings growth, business risk, leverage and investor risk premiums may change at the same time. Our guide to inflation data and Nasdaq movements explains one way these forces interact.
Why Does It Matter for Mortgages and Business Borrowing?
U.S. mortgage-backed securities and long-term loans are priced partly with reference to Treasury yields. As a result, the 10-year yield is a useful indicator for the direction of 30-year fixed mortgage rates, even though a mortgage has a different maturity, prepayment behavior and credit or servicing costs. The rates do not move one-for-one: mortgage spreads change with lender pricing, bond-market conditions and prepayment risk. Freddie Mac publishes weekly mortgage-rate averages that can be compared with Treasury benchmarks.
For corporations, higher benchmark yields can increase the cost of issuing or refinancing debt if credit spreads do not decline enough to offset the move. That may lower cash flow after interest and reduce the value of projects with long payback periods. But healthier growth can support revenues and earnings, potentially offsetting some financing pressure. See also how to calculate free cash flow.
What Does the Yield Curve Tell Investors?
A yield curve compares Treasury yields at different maturities. Investors often look at the difference between the 10-year and 2-year yields, or between the 10-year and 3-month yields.
On November 6, 2026, the Treasury’s published par yields were 4.86% for 10 years and 4.51% for two years, a spread of +0.35 percentage points, or +35 basis points. One basis point is 0.01 percentage point. These are dated reference values, not a forecast.
An inverted yield curve occurs when a longer maturity yields less than a shorter maturity. It can indicate expectations of future policy easing or weaker growth, but it is not a reliable timer for a recession or a buy/sell signal. The New York Fed’s yield-curve indicator uses the 10-year minus 3-month spread as one input to a recession-probability model.
How to Follow the 10-Year Yield Without Misreading It
Before drawing conclusions from a headline, answer four questions: Which date and benchmark? The constant-maturity par yield is not the same as an individual note’s coupon. How large was the move? A rise from 4.84% to 4.86% is two basis points, not two percentage points. What changed? Inflation expectations, growth, policy outlook and term premiums can point in different directions. Which asset are you analyzing? Existing bonds, mortgages, high-growth stocks and heavily indebted companies react differently.
Check the U.S. Treasury’s daily rates or FRED’s 10-year series rather than treating a dated quote as current.
Key Takeaways
The 10-year Treasury yield is a market-derived benchmark for the nominal cost of U.S. government borrowing over roughly a decade. It moves opposite to bond prices, informs mortgage and corporate borrowing costs, and influences the discount rates used in stock valuation. Its direction matters, but the reason it moves matters more. For investors, the practical approach is to distinguish coupons from yields, calculate in basis points, and assess changes in yields alongside inflation, earnings and financial risk.
Educational disclaimer: The note-pricing and present-value examples are hypothetical, not reported securities or investment returns. Quoted Treasury yields are historical observations on the specified dates. This article provides general financial education, not personalized investment advice.